


In this post I will speak about how we’re getting feedback from our users. This procedure includes:
- Send and collect feedback in our local Request Registration System (you can see our architecture in the http://borisfrolov.com/2012/08/12/basic-work-item-fields-description/).
- Send collected information to TFS.
- Form Application Survey reports.
So, let’s start from the beginning. When task is closed in our local Request Registration System, the requester of the task receives the following email:

Requester sees the task number, task text and link to the special page, where he can write a feedback on the work was done.

Before Office 2007 implementation this form was in the mail, but today user has to click link in order to give us feedback. The form is rather simple – user puts down whether the task was solved and sets us a mark from 1 to 5. He can also write some comments, but this is usually not done.
So, when user pushes «Submit your response» button the information is stored in our local system and then transfers to TFS and we can see it in the Work Item.
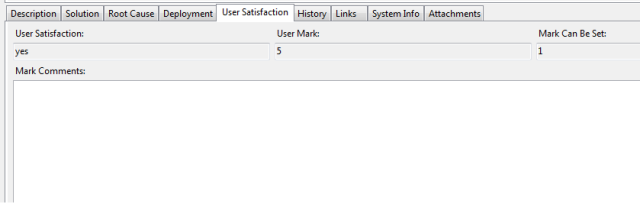
We’ve got one more field on User Satisfaction page in TFS – Mark Can Be Set. This field indicates whether task can be rated by user or not. While counting percentage of rated tasks we do not take into consideration our internal requests. In order not to overload reports logic we calculate this field while transferring task to TFS.
Now, we have come close to Application Survey report. We form this report on monthly level and it consists of three parts:
- Pivot part,
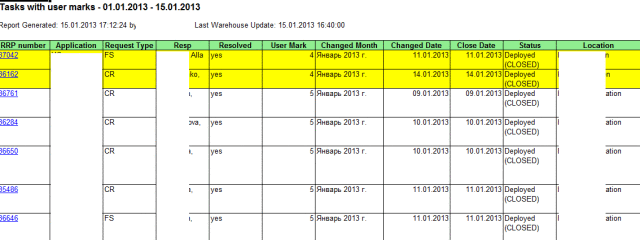
- List of closed tasks in the last month (only tasks that can be rated),
- List of rated tasks in the last month.
One important moment – list of closed tasks and list of rated tasks – they are different lists. As request can be closed in January and be rated in February. So, theoretically amount of rated tasks can be more than 100%.
Pivot report is the following:

We have several locations, and for each location we are calculating:
- Average User Mark. Our target value is 4.7.
- % rated tasks. Number of tasks that were rated by users to Total number of tasks that can be rated. We believe that 35% is rather good result.
- % Resolved. Number of resolved tasks (User Satisfaction = “YES”) to Number of tasks that were rated by users. Target value is 97%.
As you can see all values that are off the target are highlighted with color.
Lists of closed and resolved tasks are rather simple and contain all required information for some additional analysis.

 GDPR Cookie Consent with Real Cookie Banner