In this post I’d like to show what performance reports we use in our everyday work to track whether system is ok or not.
First section – reports we are receiving on daily basis.
- Timeout Report.

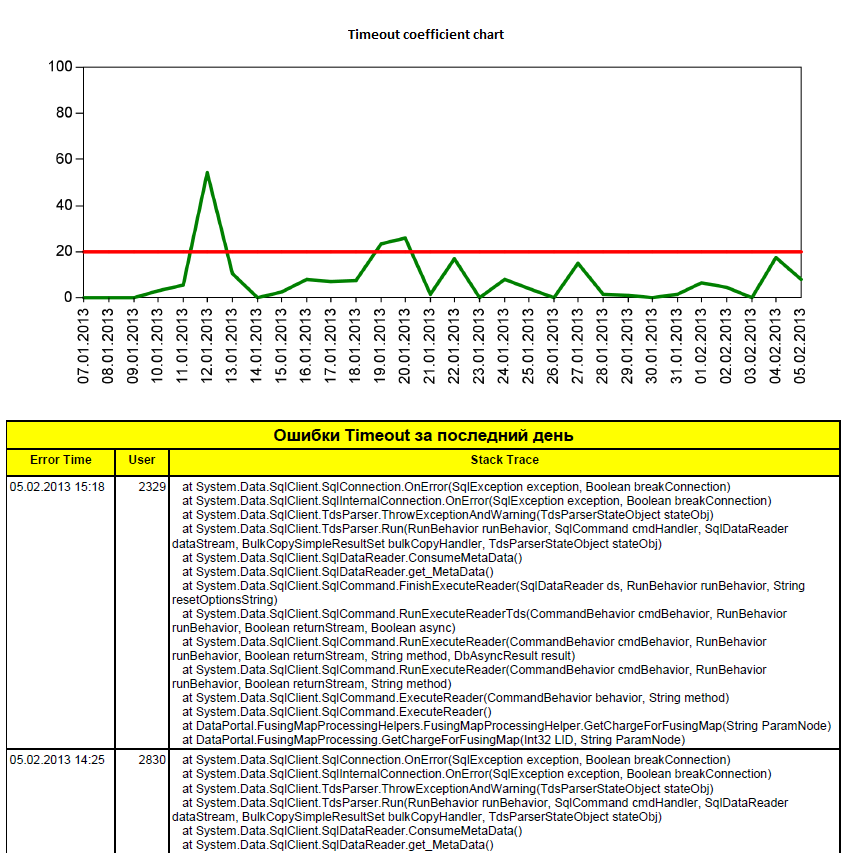
The report consists of two parts: Chart with Timeout Coefficient and List of Timeout errors for the last day. Coefficient is calculated using the formula:

For our system it must be not more 20, or not more than 10 timeouts in a normal day.
- Trends of users’ operations with documents (journal open, document open, document save). Below you can find an example for journal open operation.

The logic of the report is the following: we take all objects of the system, with operation average value for the last day higher than target metric and show how it changes for the last month. Our targets are: journal open operation and document open operation – not more than 1 second, document save operation – not more than 2 seconds. With the help of this report we know all objects that work not well for the last day, and can easily understand, was it a one-day problem, or there are permanent issues with the specific document.
Next section – reports we are receiving on weekly basis:
- Pivot results for users’ operations with documents:

This report uses the same information as previous one, but shows it a little differently. It calculates how many problem days we have with each document for the last 3 months and put an average value that was higher than our target for each problem day. If a document has more than 30 problem days it’s colored red and is the first candidate for the optimization. Documents with amount of problem days from 10 to 20 – are orange all others are green. We use this report for making decision what operation with what document required optimization.
And the last section – monthly reports:
- Reports monitor

Sections of the report have quite detailed descriptions, so I will dwell on its features. Document print forms – rather small reports, usually print forms of specific document. They must be rather quick in general, that’s why we calculate average time for them. For large reports, average time cannot be used, as the report can be formed without filters and return 100 000 rows or with restrictions and return 10 rows. So for large reports we catch only cases when they work for more than ten minutes, thus providing high load on server resources and making user to wait for quite uncomfortable amount of time.
So, that’s all for today and in the next post I will talk about how all this system of performance control works on a real-life example.


